Do you want to know the SECRET behind the ability that McKinsey consultants have to instantly “grasp” the most important issues about a company or industry?
Well, the secret is simple: top management consultants have mastered the use of profitability trees to understand business problems.
Seriously, that’s a big part of it.
Why? Well, because profit problems are the #1 concern most CEOs have.
And Profitability Trees are the #1 tool to understand how to fix and improve revenues in any business.
In this guide you'll learn:
- What are Profitability Trees and why this is the most important tool to analyze business problems.
- How to MASTER the traditional “Profitability Framework” so you can get a high-level view of how to improve profits in any company (regardless of industry).
- How to create CUSTOMIZED profitability trees in 4 steps so you can generate deeply insightful profit-enhancing recommendations.
- How to APPLY Profit Trees through three in-depth examples in different industries.
Ready? Let’s get started!
What are Profitability Trees (and why should you care)
Profitability trees are a special kind of issue tree, that is created with the sole intent of analyzing the profits of a company.
And here’s why they’re so important:
Every business wants profits.
Even more, every business needs profits.
And skillfully using Profitability Trees is the most efficient, direct way to understanding how a business makes profits and why it’s not making more of them.
But…Aren’t they too simple?
Before we dive in, let me clear up the main objection people have against using Profitability Trees: that they’re too simple (and, so the logic implies, too simplistic).
Yes, profitability trees are simple.
And yes, a lot of people know about them.
But that doesn’t mean you should underestimate them.
Why?
For two reasons:
1) There are many, many nuances in how you can and should use Profit Trees to solve different problems. Get these nuances right and you’ll see insights faster than any person in the room. (Or, get them wrong and you will seem like a fool.)
2) Profitability Trees can be used to solve pretty much any business problem. Sometimes they may be the primary tool, other times just a secondary one. But they’re always useful because in any business situation that affects profits (which is pretty much all of them) you’ll want to know how that affects profits.
And because profitability trees are so ubiquitous, and yet so nuanced, I call them the “chef’s knife” of management consulting and business strategy.

If you’re not into cooking, you might be wondering why I’m making this analogy…
Well, here’s a passage from Wikipedia’s article on the Chef’s Knife:
“A modern chef’s knife is a multi-purpose knife designed to perform well at many differing kitchen tasks, rather than excelling at any one in particular. It can be used for mincing, slicing, and chopping vegetables, slicing meat, and disjointing large cuts.”
It’s a multipurpose tool every chef uses every day.
Just like that, a Profitability Tree is useful for so many things that it becomes THE ONE problem-solving tool you must master if you want to learn to think like a McKinsey, Bain or BCG consultant and excel in your case interviews and your career.
Which is why I wrote this guide. I’ll give you all the knowledge and tools you will need to master profitability trees so you can use them the right way.
I’ve broken down this guide in three sections:
Section 1 will cover the basics of the Profitability Framework.
In it I will show you how most people use Profit Trees, what is its underlying logic, why it’s different from a income statement and how to find the four core profit drivers in it.
In Section 2, I will show you how to customize your Profitability Tree.
This is the KEY STEP that everyone misses. If you’re always breaking down PROFITS using the same drivers, regardless of industry and business situation, you’re missing so much nuance and information you will sound naive. Section 2 is where advanced candidates will get the most value.
Finally, in Section 3 I will show you a few examples of customized, applied profitability trees and break down what makes each of them great.
Ready? Let’s go.
The Basics of the Profitability Framework
You might have heard of the so-called “Profitability Framework” if you’ve been studying for case interviews for a while.
It looks like this:
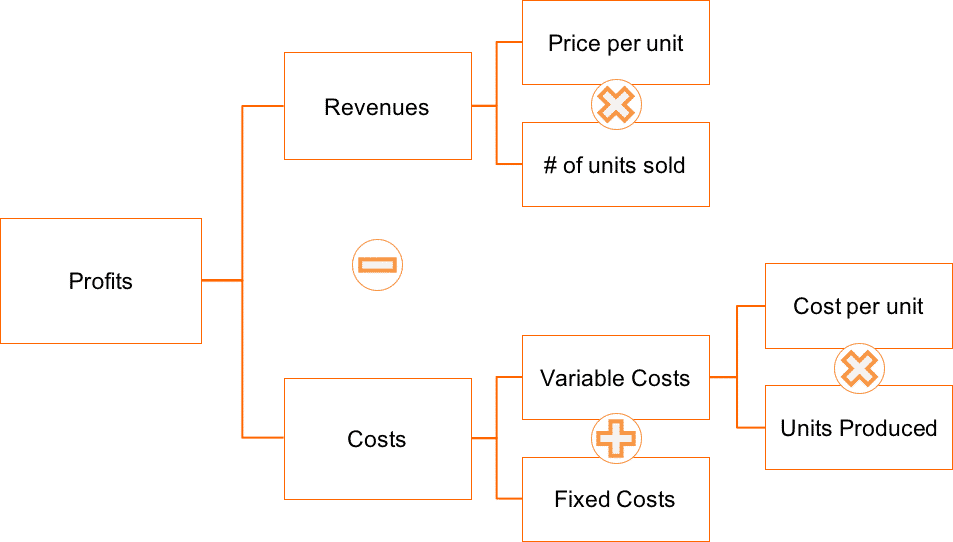
The Profitability Framework is the most basic form of a Profitability Tree.
So, let’s start with it as a starting point on how to create and use profit trees to solve business problems.
(And by the way, the right way to use Profitability trees is NOT by rehashing this old framework in every opportunity you have).
As you can see, it is a very simple tool.
It basically breaks down the profits of a company into an equation: Profits = Revenues – Costs, and then that equation into more detailed variables.
(The complete formula would be “Profits = (Price per unit * # of units sold) – [Fixed Costs + (Cost per unit * # of units produced).
And it puts this whole equation in a layered format so you can see what’s happening to the drivers of a company’s profits in different levels of abstraction.
It’s a very visual way to see what’s wrong.
But if you’ve taken any accounting classes at all, you might be noticing something… The “Profitability Framework” is basically a different version of the income statement!
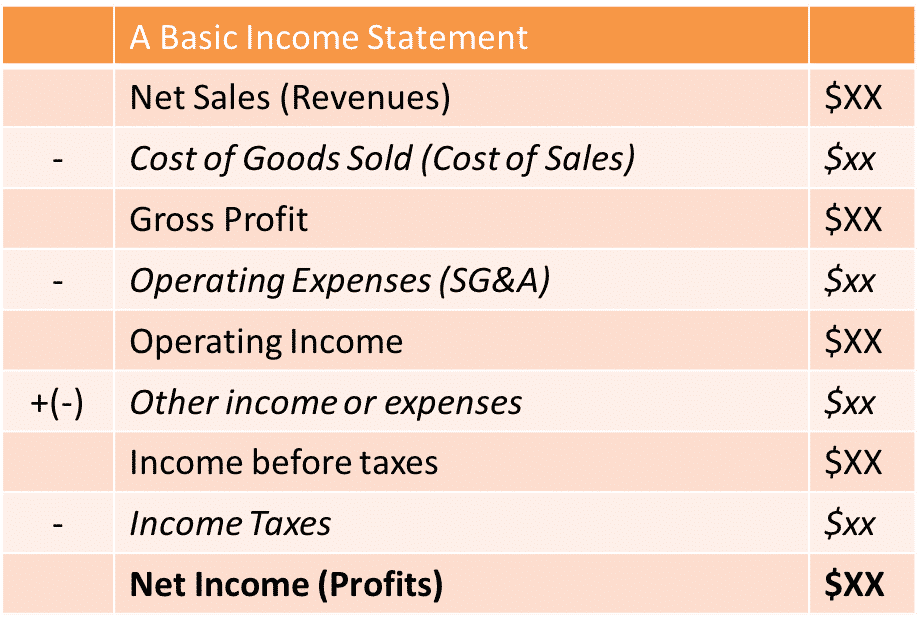
So, what’s the big deal with this Profitability Framework? Are consultants just glorified accountants?
Not really.
As you’re gonna see by the end of this guide, consultants rarely use the pure Profitability Framework to help their clients – instead, they make custom profit trees.
But that’s Section 2, we’ll start with the basics first.
There are two main differences between the Profitability Framework and the basic income statement that you learn about in Accounting 101.
The first, and most obvious difference is the format.
The income statement starts at revenues and takes out different costs and expenses until you reach to the bottom line (that is, profits).
The profitability framework starts at profits and breaks it down into the components.
The second and most important difference is that the income statement looks at things from an accounting/taxation perspective.
It separates costs of producing items from other expenses in part because the taxation of both things is different. It talks about taxes and such.
You’ll see no such thing in the basic Profitability Framework.
Why?
Because that framework focuses primarily on managing the company. And because of that, it prefers to categorize costs in a different way (Fixed vs. Variable). It also gives a bit more detail on how revenues are created (Price * Quantity).
These seem like small differences to care about, but they actually touch on something quite profound…
The Profitability Framework highlights the fundamental drivers of profit in a business
Let me show you two profit trees of two different companies.
I’m not gonna give you any details about these two companies… I’m not gonna tell you in what industry they’re in. I’m not gonna tell you how big they are. I’m not even gonna tell you whether they’re in the same industry or not.
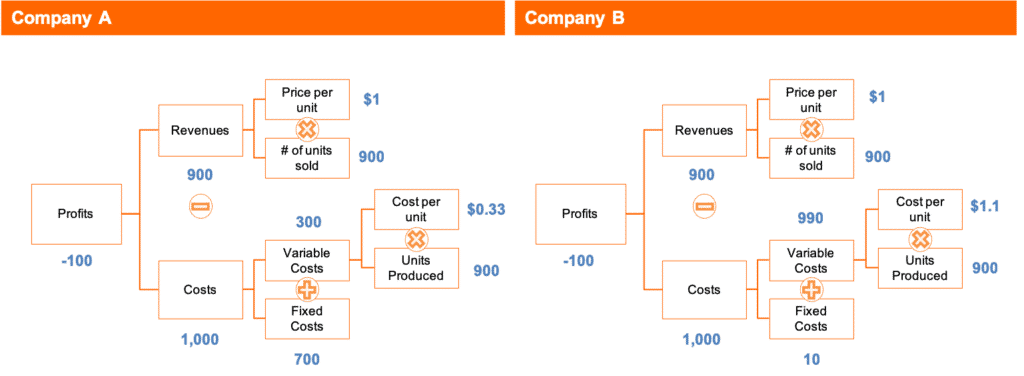
Do you see what I see?
These companies have the same profit (in this case, both are at a loss). They also have the same revenues and the same costs.
In fact, an income statement for both of these companies could look EXACTLY THE SAME.
However, these two companies face profoundly different problems.
What would you recommend each company to do?
Go back to the profit trees and form an opinion before you keep reading!
I don’t know about you, but I’d tell Company A to focus on growth and selling more units.
If they could grow units sold by 16% they would break even, and if they grew more than that they could eventually become highly profitable. That’s because most of their costs are fixed, and they have pretty healthy margins per unit sold.
However, I would NEVER recommend Company B to grow sales.
They currently lose $0.10 for every sale they make, because their variable costs per product are higher than the price they charge. If they grew sales, they’d just lose money more quickly.
Instead, Company B has to urgently raise prices or cut variable costs down. And if they can’t do any of those, they should just shut down.
Now, what’s amazing to me is that we can have a fairly strong idea of how to fix those two companies even though we have ABSOLUTELY NO CONTEXT.
We don’t know in what industry they are.
We don’t know if they’re huge multinational corporations or small local businesses.
We don’t know what their strategy is.
And with a tiny bit of context, we can get to even more insights…
Suppose for a minute that we know these two businesses are in the same industry and that they compete with each other.
What are some key insights that we can make based on this simple notion?
Well, one thing that’s in plain sight is that these two firms have different methods to produce and distribute their product or service.
Company A is intensive on fixed costs but has high margins. Company B has very low fixed costs, but has negative margins.
So, if these companies make and sell the same product, Company A might have factories and equipment and uses very little labor and perhaps wastes less raw materials, while Company B works with very little tooling and depends more on a variable-cost type of labor (they may even outsource production).
If this were the textile industry, Company A might be a well-equipped, automated factory, and Company B might be an army of seamstresses with simple machines.
I don’t want to get too deep into this, but having that awareness that these two companies have different cost structures and compete with each other delineates the strategic options they may have.
For example, if Company A decided that they will decrease prices to increase market share and dilute fixed costs, there’s nothing Company B can do because they can’t decrease prices along with them.
Another example: if the whole market crashes and both companies lose sales, Company A is doomed!
They’ll have to sell factories and fire people and may still lose more money than they lose today. They may need to shut down.
Company B, however, will be just fine.
They have very little fixed costs and depending on how the market behaves, they may lose even less money than they do today. If Company A shuts down and they become the only in the market, they may even be able to raise prices and become quite profitable.
Now, I want you to realize something…
I’m finding A LOT of insights with almost nothing to work with. I could NEVER do that with an income statement.
With just a few differences from its cousin, the Profitability Framework is much, MUCH more powerful.
Which begs the question… How can it do that?
Why is the Profitability Framework so powerful?
The power of the Profitability Framework lies in the fact that it distills a business’ profits into its four core profit drivers.
Here they are:
- Volume sold (and produced – they should be similar in long enough timeframes)
- Price per unit sold
- Cost per unit
- Fixed costs
You just need to know these 4 factors to successfully build a basic Profit Tree for any business.
And by knowing these 4 factors, you’re able to understand, from a very high-level, what are the main issues going on in this business:
- You can find the “unit economics” of the business – how much does selling one extra unit will bring you in profits – by taking the cost/unit from the price/unit.
- You can understand the cost structure of the business by comparing fixed and variable costs – understanding your cost structure is the key to know what are your risks and if revenue growth is a must-have or a nice-to-have.
- You can easily calculate your “break-even volume” – how many units you have to sell to “pay” fixed costs and start being profitable.
- And with a little benchmarking and context of the business situation, you can quickly pinpoint which of the 4 profit-enhancing levers is easiest and most reliable in terms of improving the bottom line.
Amazing how much just four numbers can do for you, isn’t it?
But unfortunately, the “Profitability Framework” is not enough for most situations…
Yes, if you use it as it is, you may reveal the key issues in a certain business.
Yes, analyzing a company’s 4 core profit drivers will help you out.
But if you have just about any practice solving case interviews or analyzing real-life businesses, you know that even though applying the profitability equation to a business will sometimes yield INCREDIBLE results and insights, other times it will just yield nothing interesting at all.
To see an example, check out these Profitability Trees from two supermarket companies:
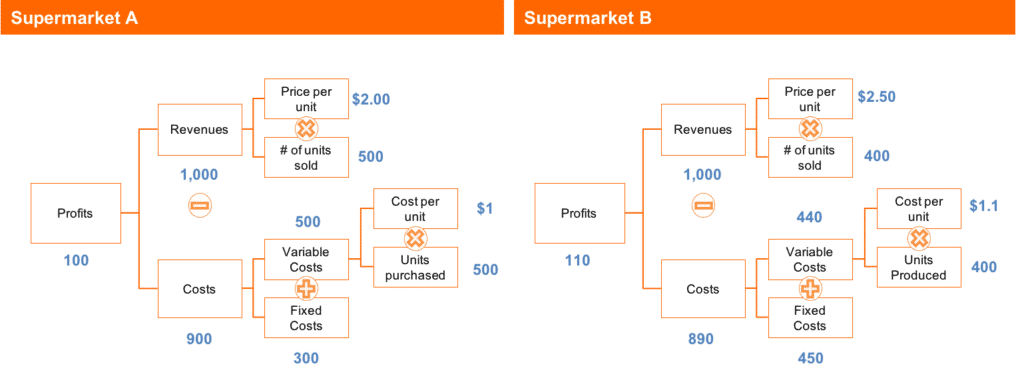
There isn’t much going on here…
Yes, we can come up with some hypotheses about those two businesses based on these two issue trees:
- Maybe Supermarket B targets a higher-income market as they sell products that are more expensive, have higher margins but also need to have higher fixed costs (more expensive rent and more staff for the more demanding customers).
- It could also be the case that they both target a similar market, but Supermarket B is a more local, smaller format supermarket that is also more expensive, so people buy less stuff (only the required for the day) and are okay paying more for convenience. The higher fixed costs might come from inefficiencies or any other factors.
- Another hypothesis: these two supermarkets are similar in market and store format, but they’re located in different cities or neighborhoods, and the consumption habits of these two places are different. For instance, they buy different types of items from supermarkets vs. other retailers such as convenience stores.
These hypotheses are still slightly interesting and may or may not lead to something.
But they lack the analytical punch we were able to bring in the first example of Company A and Company B.
Why?
Well, partly because this scenario is a lot less extreme in terms of the differences between the two companies, and partly because we’re not talking about generic businesses anymore.
We’re talking about a specific industry, the supermarket industry.
The easy way to 10X any profitability analysis
Does that mean that Profitability Trees are not all it’s cracked up to be?
Does it mean I’ve wasted my time writing this article (and yours, as you read it)?
Not really!
The core problem of the Profitability Framework is that it’s a “one-size fits all” solution to decode the essential question of “why a company is profitable or not, and how to get it more profitable”.
And even though mathematically the 4 core profit drivers work in any business from any industry, they don’t always make sense intuitively.
Both of these things are important.
For example, if you’re working with a company in the smartphone industry and you find out that the average price per unit sold went from $300 to $400, that not only is correct mathematically, but it also makes intuitive sense.
However, saying that Supermarket A sells its average product for on average $2.00 and that Supermarket B sells it on average for $2.50, as in the example above, doesn’t make intuitive sense at all.
People can buy THOUSANDS of types of products in a supermarket, from coffee to utensils to outdoor vehicles.
A jump from $2.00 to $2.50 as the average price/unit in a supermarket could mean a lot of things:
- The store has raised prices in all products and people are paying for it.
- The store hasn’t changed any prices and people are buying more premium products.
- People are buying the same items, with larger package sizes (and same prices per volume of the items).
- People are buying different product categories. For example, they used to use the supermarket primarily to buy staple food items, but now they’re getting staple foods delivered via online subscriptions and only use the supermarket to buy specialty items that are not getting delivered to them.
These four examples of things that could be happening are completely different from each other!
Actually, bullet point #3 means very little to the supermarket’s business and #4 could actually be harmful as people may be buying LESS things from supermarkets in general (e.g. Supermarkets as an industry are getting eaten by Amazon Prime).
Which is again to say that applying the one-size fits all “Profitability Framework” to supermarket business is somewhat interesting but not very insightful.
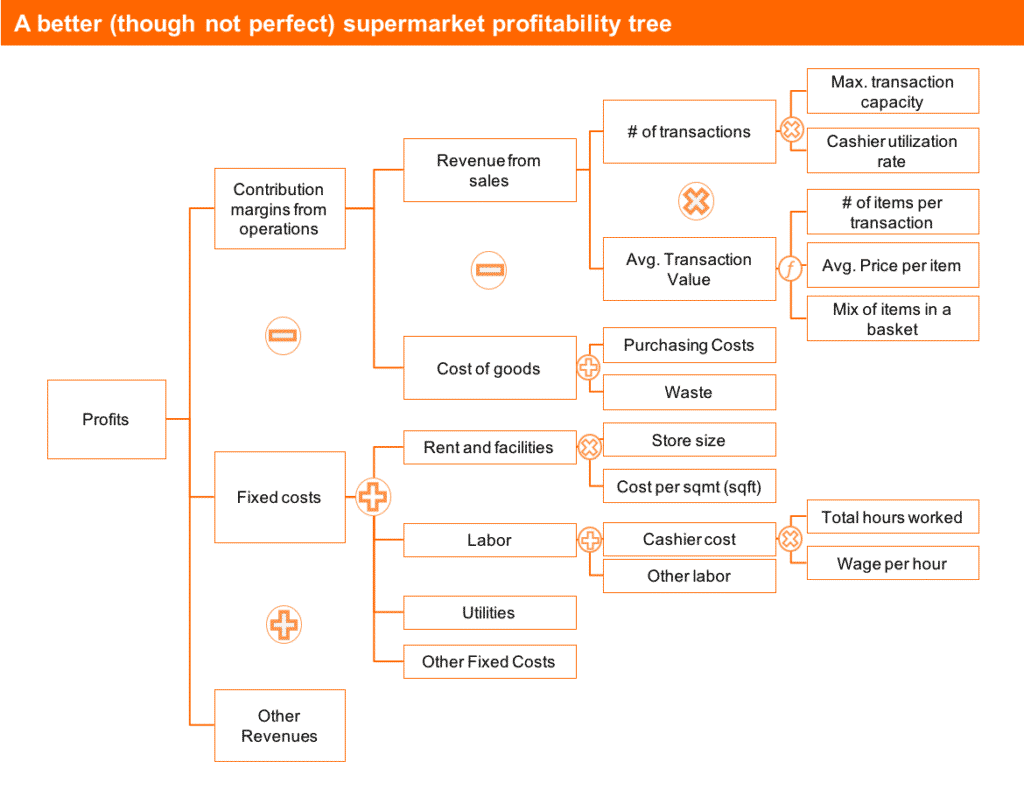
But see what happens when we look at Supermarkets A and B through a more customized profitability tree designed specifically for the supermarket industry:
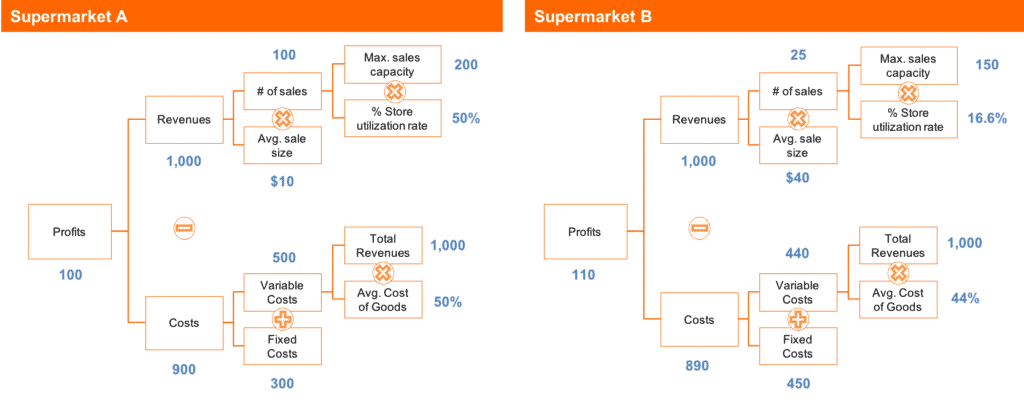
There are three new pieces of information here that were not in the generic profitability framework:
- Instead of seeing the average price per product sold (which doesn’t mean much for a supermarket), we can now see the average sale size (or average ticket size, as they speak in the industry) – this is a very intuitive number to know about. A supermarket that sells on average $10 per transaction is very different than one that sells $40 per transaction.
- We can now see variable costs as a function of de avg. costs of goods sold in percentage terms. That tells us the gross margins of this supermarket, a number that’s very useful to know when your whole business is to buy products and mark them up to a value that customers are willing to pay.
- Finally, I’ve broken down the number of transactions as a function of the maximum sales capacity (that is the total sales they could make if cashiers were full all the time – “# of cashiers * max. transactions per cashier”, if you will) and the % of utilization rate – this gives us a measure of how filled with customers these supermarkets are (and it’s a better measure than # of customers alone because different store formats expect to get a different # of customers).
These trees are NOT the ULTIMATE profitability trees for supermarkets. They’re actually still pretty simple. But they do give us a much clearer picture of what’s going on. Here’s my take on it:
- Supermarket A does a good job filling up the store with customers (50% occupation means it’s probably full at peak time) and seems to have healthy margins (compared to Supermarket B), however, they can probably do a better job selling more for each customer that visits them. If I were managing that company, I’d probably focus on increasing transaction size.
- Supermarket B, on the other hand, has great margins and customers who shop a decent amount with them every time they visit, but their stores are empty. That’s a big problem, especially since their fixed costs are so high. If we think that the main fixed costs are likely to be (1) the store itself and (2) labor, we basically have a large store full of employees and very few customers. If I were them I’d put all my efforts to bring in new customers to the store and if that’s not possible, I’d resort to cutting fixed costs.
Using a customized profitability tree makes your analysis both more precise AND more intuitive. It is the surest way to impress your interviewer and solve a profitability case quicker and with more assertiveness.
It is also one of the best ways to talk sense with your clients and not having them think you’re “smart, but too theoretical to help them out”.
Which brings us to the key question of this article: how can you create structures like this?
How to Create Customized Profitability Trees
Ah, customization.
The quintessential aspect of great consulting work.
In my view, the main reason why top consultants are so highly paid and respected is that they can adapt academic business theory (that seems to only work in theory) to the specifics of each client and their situation.
Being structured, hypothesis-driven and everything else related to consulting is merely a means to that.
Management consultants, in essence, bridge the gap between theory and practice.
They deeply understand their client’s situations and are able to understand which piece of “theory” fits their situation. They’re also able to mix and match different theoretical frameworks to solve unique problems, and often times they even come up with theory on their own.
What does this has to do with creating customized profitability trees, you ask?
Everything!
As we saw on the supermarket examples above, having a customized structure to solve your problem lets you see it in a more intuitive way.
It also helps you see what the problem may be a more precise way.
And what we did to build it was to essentially build the gap between theory (the archetypical profitability framework) and the practice (how a supermarket really works and the metrics that matter for them).
And in fact, we could’ve done an even better job. Here’s how I’d build an even better profitability tree for the supermarket industry:
(I’ll teach you how to build it in this very section!)
This Profitability Tree is fully customized for the supermarket industry.
It wouldn’t be as good for any other type of business (although it could work well for some other types of retailers).
It’s still not perfect, though – no issue tree is perfect (and perfect should never be your goal).
For example, I didn’t include credit card processing fees in there.
Had I included it and all possible costs of a supermarket, the tree wouldn’t be perfect either as it would be too extensive and not 80/20.
When building any kind of issue trees, including profitability trees, you’re always aiming for very good, not perfect.
Still, it helps to know what makes this profit tree very good before we jump into how to build trees like these.
Here are the three main reasons:
Reason #1:
It breaks the first layer of a supermarket’s profits in a way that better resembles how supermarkets make money.
I always tell people to break down profits into “Revenues – Costs” in 99% of their cases.
Why?
Because it works.
However, I made a point to show you an example where breaking it into a different pattern still makes sense.
And I added “Other Revenues” because although supermarkets make the bulk of their money from selling consumer goods, they can make money by selling shelf space, along with other revenue sources.
The important thing to have a strong issue tree is to question whether Revenues – Costs is the best break down you can use for your first layer.
It is going to be the right way to go in 90%+ of the cases, but because the first layer is so critical to have a strong issue tree, we must be extra careful here.
Reason #2:
Revenues and Costs are described in a way that actually represents how the business operates.
One way or the other you’re gonna have Revenues and Costs somewhere in a profit equation.
That’s just how business works.
But there are often ways that represent how a specific type of business generates revenues and produces costs better than what the traditional “Profitability Framework” tells us to look at.
More on how to create specific revenues and costs for any business later, but for now just be aware that how you break down revenues and costs must be specific to the way that specific business runs.
Reason #3:
It goes deep into some important specific revenue and cost drivers.
Great issue trees and profitability trees go deep. Period.
There are certain things that are uniquely important for each industry that you’re doing a lousy job if you don’t consider them in your analyses.
For a supermarket that might be “cashier utilization rate”, the “mix of products sold” and “store size”.
Some other things are mildly relevant and you can choose to add them or not.
For example, refrigeration could be an important cost in a supermarket, but I chose not to detail that under “utilities” because it’s not as big of a cost as purchasing and labor, and because there are fewer ways to optimize it significantly in most stores.
Pro tip: Great profitability trees allow you to infer the most important industry-specific metrics.
Have you ever noticed that different industries have different success metrics?
- In retail, you have sales/square meter (or sqft in the US)
- In airlines, you have revenue/seat
- In professional services (including consulting), revenue/consultant is critical
Great profitability trees always allow you to see those metrics and calculate them.
Why? Because of reasons #2 and #3 above… They describe revenues and costs in a way that’s relevant to the business and they go deep into the drivers that matter (sqmt in a store, # of seats in an airline, # of consultants in a consulting firm).
The standard profitability framework gives you such a high-level, generic view of a business that it doesn’t allow you to do that.
So one way to know if you profitability tree is specific enough is to see if you can infer most of an industry’s performance metrics from it.
Anyway, enough with understanding what makes a profitability tree good, let’s jump into how to actually build them.
You can do so in 4 steps:
Step #1: Choose your first layer (Hint: it's "R-C" 90%+ of the times)
Okay, so the first step is quite obvious: to choose the first layer.
The first layer is critical because it shapes the quality of the rest of your profitability tree.
Luckily for Profits, the first layer that makes most sense most of the time is the simple “Revenue – Costs” equation.
Why?
Well, because most (if not all) businesses have Revenue sources and have Costs to pay.
As simple as that.
However, there may be other situations that will demand other types of first layers:
- A conglomerate such as GE or Samsung (that makes anything from smartphones to ships) needs to separate it’s different businesses before they analyze profits – if you clump all revenues and costs from all their different businesses together, the information gets mixed up and won’t make much sense.
- A company like Apple might want to separate its different revenue streams from each other – Apple Watch has its revenues and costs that are separated from the iPad’s.
- In a similar sense, a company that sells say, software and consulting services should separate the revenues and costs of each, as they’re different business models.
- And finally, you may want to use another type of equation as I did in the supermarket example. It can be “Contribution Margin – Fixed Costs”, “Revenues * % Margin” or something else entirely. I don’t recommend you to do this unless you really know what you’re doing – you get way more risk for very little benefit. In all situations like this you can simply use “Revenues – Costs” and be effective.
Now that you’ve done your first layer, you need to build the rest of the profitability tree.
From now on in this article, I’ll assume you’ve used the “Revenue – Costs” formula because it’s the simplest (and often most effective) way to build the first layer.
Step #2: Choose your Revenue Model
Most people think Revenues = Price * Quantity.
But as we’ve seen, at least for a supermarket, Price * Quantity doesn’t make much sense. The average price per product is not a very intuitive metric when you’re selling thousands of products at vastly different price points.
It also doesn’t explicitly show they make each customer buy more stuff, one of the most effective levers to increase a supermarket’s performance.
So for a supermarket, one way to break down revenues that makes more sense is “# of transactions * avg. transaction value”.
(And if you want to use “Price * Quantity”, feel free to break down “Avg. transaction value” into that).
We call this a “Revenue Model”, because it’s how a company “models” and “sees” its own revenues.
Different industries have different revenue models.
Some companies become so successful in part because they see their revenue model in a new way that the rest of the industry does not.
(Amazon, for instance, is all about increasing how much each customer spends with them in their lifetime, instead of trying to optimize for transaction size as many pre-Amazon retailers did).
For a more in-depth discussion of Revenue Models, with a variety of them and how to pick the right one for your case, check out this Youtube video:
Step #3: Create a cost structure with a list of major costs
Now that we have a first layer and a specific cost structure for the business, we need to dig deeper into costs.
What most people do within costs is to break them down into Fixed and Variable costs.
And that works!
For starters, it’s an easy way to break it down.
Also, there are usually meaningful analyses that can come up out of it because these two costs behave very differently as the business grows.
Finally, it usually helps you think of specific cost lines for that specific business.
However, you could also use a “Direct + Indirect” cost structure, or even a Value Chain based cost structure, where each category is related to one step in the value chain (so, for an auto manufacturer that would be “Purchasing, Manufacturing, Quality Control, Sales + Indirect”).
These structures work. I personally use all of them, depending on the specific case.
However, you can’t stop there. You need to go deeper.
If you present a structure such as “Fixed + Variable costs” in a case interview, 9 out 10 interviewers will ask you this question:
“What are the main fixed and variable costs for a company like this?”.
This is a Brainstorming question, they want to test your understanding of business.
Why?
Because if they put you into a project in an airlines company and you can’t figure out on your own, before reading any reports that fuel and maintenance are two big cost lines in this business, you’re gonna be a pretty lousy consultant.
Notice that this doesn’t mean you have to spend late evening cramming what are the major costs in 20 different industries.
You don’t have to have read about business at all to infer that fuel and maintenance are important in the airline industry. All you have to do is to think of your own car and apply some common sense.
Or, you can use this method to think of your structures:
1) Put your “Fixed + Variable” structure on paper.
2) Hold a structure on the costs to “Make, Sell and Support” in the back of your head.
3) Think of cost ideas in each “quadrant” of your structure, as you visualize how that business makes and sell products (or services) and who is needed to support the operation.
Here’s how this cost brainstorming technique looks like for the supermarket and the airline industries:
While you can show both structures used to generate costs to your interviewer, in most cases I’d just recommend showing the “Fixed + Variable” cost structure while keeping the “Make, Sell, Support” structure in the back of your head.
That helps to make things less confusing.
In practice, what you’d show to the interviewer is this:
When you use this technique, you know you have all the important costs of that business.
Why?
Because by using two structures in a “matrix” format, you’ve used a very granular approach to think of them.
You can explicitly show this secondary structure to the interviewer or not, but the important point is that you show your interviewer many of the specific costs that are important for that business.
Even better: explicitly tell them which ones are most important.
Clearly, in a Supermarket Business, purchasing items is very relevant.
Clearly, plastic bags won’t make or break a business in this industry.
But how about waste?
How important is that?
My guess is that it’s a bit important, but it’s more of an operational problem (having good inventory control, reliable refrigeration, etc) than a critical part of a supermarket’s strategy.
In a case interview, I’d make all this reasoning behind the importance of each cost explicit, as it shows thoughtfulness and it shows you know what you know and what you don’t know.
But Bruno, how do I know which costs are Fixed and which are Variable?
This is a question I get all the time.
People are told they should break down costs into “Fixed vs. Variable” and then they freak out.
They get insecure because they don’t know about a specific cost line.
They start discussing specific technicalities in an unusually nervous way as if they were about to anger the Cost Gods.
Let me clarify this for you, starting from the first principles.
Why do consultants LOVE to break down costs into Fixed and Variable?
Because they behave differently.
Fixed costs stay fixed. (Or do they?)
Variable costs, well they vary.
But here’s the deal: while there ARE perfectly fixed and perfectly variable costs, most costs are in the grey area. And these generate the bulk of the confusion.
Here’s a useful guideline: if you’re unsure if a cost is fixed or variable, and you notice that “it depends”, categorize it where you think it makes the most sense and explain its behavior to the interviewer.
Showing you understand a cost’s behavior is more important than categorizing it in the “right” bucket.
Let me show you the 4 most common cost patterns that are common in case interviews and business problems in general:
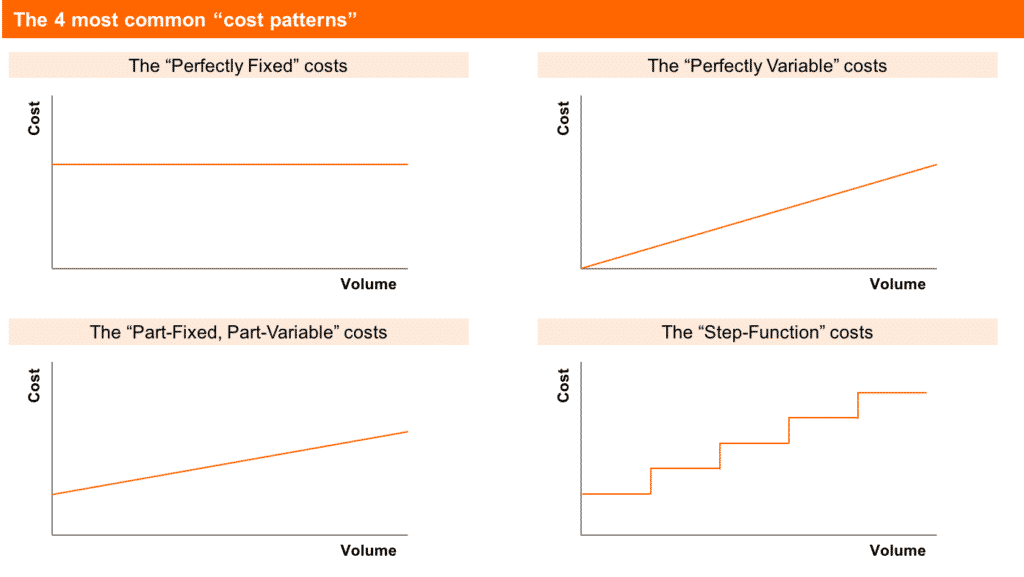
No one thinks the products supermarkets purchase could be a Fixed Cost.
And no one thinks their G&A could be Variable.
What gets people confused is the 2 types of “grey area” costs.
Take refrigeration in a supermarket, for example…
Is it Fixed or Variable?
In my Supermarket Profit Tree, I have categorized it as a Fixed Cost (it’s implicit under “Utilities”). The reasoning is that even if a supermarket sells nothing, they’ll still have to pay for their freezers and electricity to keep them on.
However, one could argue that the more they sell, the more they’ll spend on refrigeration, so it should be a Variable Cost.
Who’s right?
Both! Refrigeration costs are “Part-Fixed, Part-Variable”.
So where should you categorize it? There are a couple of ways to think about it:
- You could categorize it in the bucket that represents the highest part – of a $1000 dollars spent in refrigeration, how much is fixed and how much is variable? You can put the cost in the part that represents most of the cost. But how would you know this if you haven’t worked in a freezer manufacturer before? You won’t.
- You could put it in both parts of the structure, and call one cost “Fixed Refrigeration Costs”, and the other “Variable Refrigeration Costs”. But should you spend that much time and energy in these minutiae? Probably not worth it.
So, what’s my recommended approach?
Put in the one you think makes the most sense and either explain to the interviewer that you’re aware that is partly fixed, partly variable OR don’t explain anything at all but be able to address that concern if your interviewer raises it.
Another thing that causes confusion in categorizing costs is that costs might vary according to many things.
For example, in the Airline Costs example, I’ve determined that what I call “Variable Costs” are “Variable Costs Per Flight”, not “Variable Costs Per Passenger”.
From a Passenger perspective, a Variable Cost per flight (such as the Airport Landing Fee) might as well be a Fixed Cost.
From a Flight perspective, a Variable Cost per route (such as the Regulator Licensing Fee) might as well be a Fixed Cost.
So before you call a cost Fixed or Variable, you need to explicitly determine what metric is it variable against.
(Or just be ok with the ambiguity, that is fine too).
Bottom line: Focus on being able to understand and describe the behavior of the cost, not the “knowledge” of whether it is “Fixed or Variable”.
You’re being tested for being able to realize the nuances and explain cost behaviors, not for “having knowledge” and “being right”.
Step #4: Go deep into the most important, specific revenue and cost drivers
We could stop in Step #3 and have a profitability tree better than most.
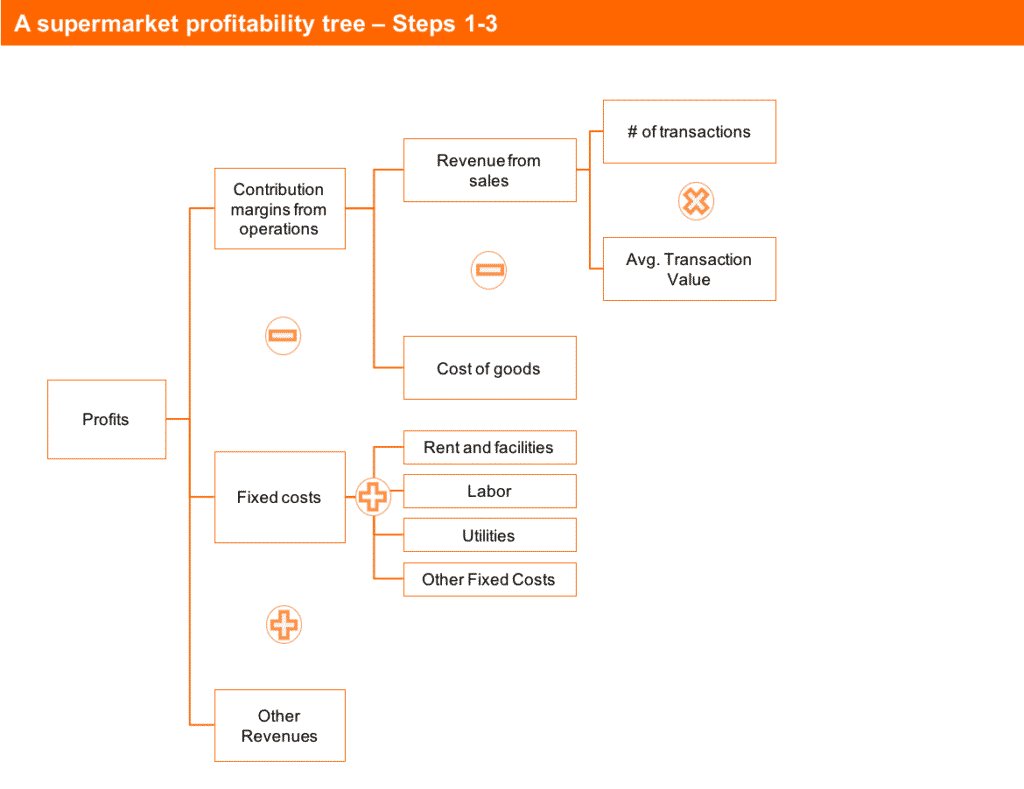
If we built one for a Supermarket company up to Step #3, it would look something like this:
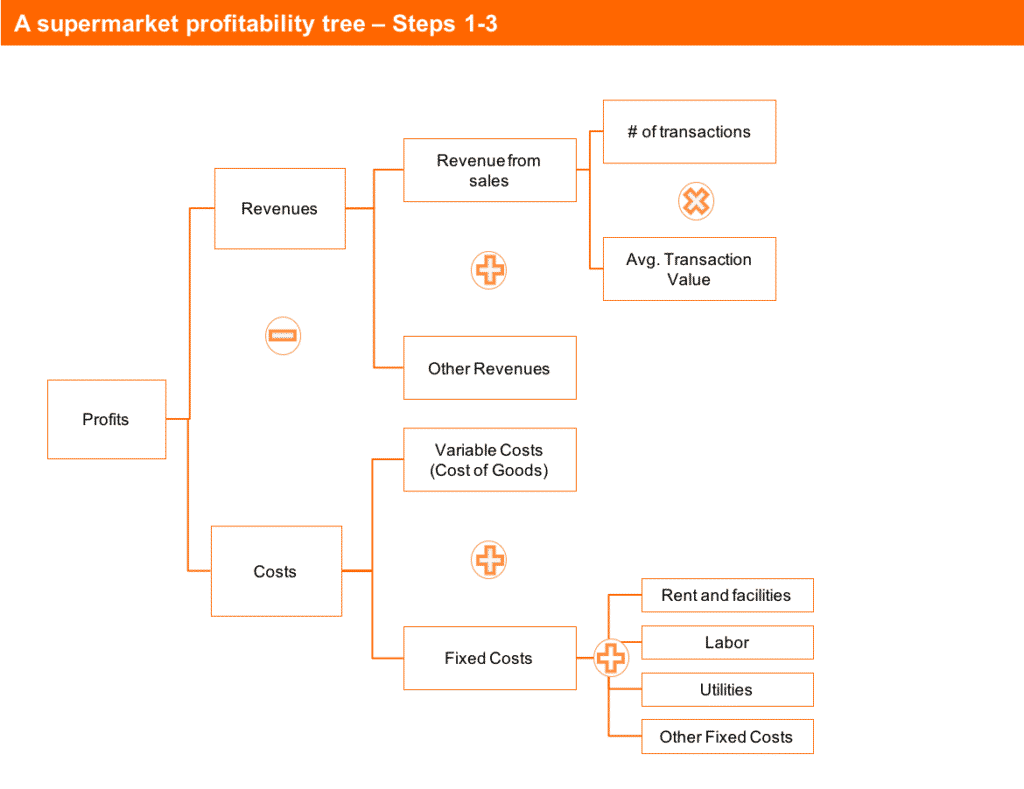
Or, even better – we can just keep things simple and use “Revenues – Costs” as a first layer. We’d have this profitability tree then:
Both trees are the same, in practice – the only change is how they’re organized.
I’ll talk about this last tree that uses “Revenues – Costs” as a first layer from now on in the article for simplicity’s sake.
So, we could stop here and have a better tree than 90% of candidates.
It’s even a good profitability tree for an experienced practitioner.
Why?
Well, because with a few questions about each bucket, you can get a pretty clear picture of what’s happening to a supermarket’s profits. In fact, in a case interview, this is the point where I’d try to get some data (before even doing Step #4).
But remember our original supermarket’s profitability tree I used as an example earlier in this article? It was special for three main reasons:
- It had a great first layer that described how a supermarket makes profits (though Revenues – Costs works well here too)
- Revenues and Costs were broken down in a way that resembled how the business operates (we’re still doing well here)
- It went deep into the most important, specific cost revenue and cost drivers
We haven’t covered this last point yet. An issue tree built with steps 1-3 simply cannot do this.
Yet.
So what should we do?
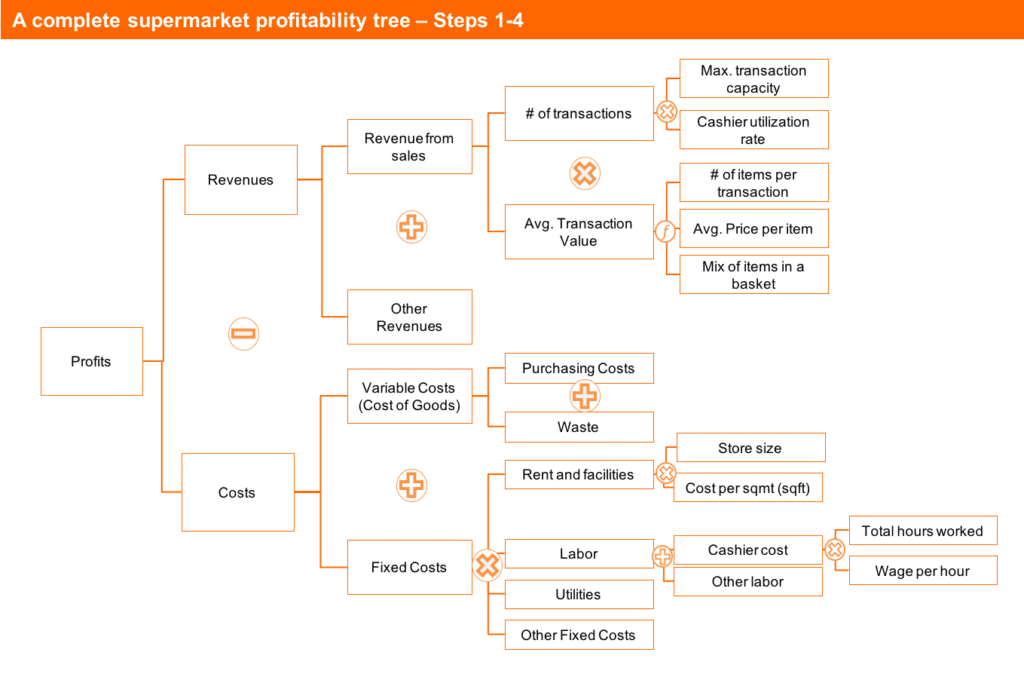
Well, we should pick the most important buckets from the profit tree we have and dig one level deeper. This is what will bring out the specific revenue and cost drivers of a supermarket.
- For “# of transactions”, we could look from the demand side (“# of total transactions in the region * market share”) or from the supply side (“max. transaction capacity * cashier utilization rate”). I’d pick the second as it’s easier to interpret the results of whether we should expand demand or cashier capacity in order to grow revenues.
- For “avg. transaction value”, the obvious way to break it down is “# of items per transaction * avg. price per item”, however, I’d like to bring the matter of which items are being purchased here too, so I’ll split the “avg. transaction value” as a function of those two things AND the mix of items in the basket.
- For the cost of goods, I’d break it down into “purchasing costs of items sold + waste of items not sold”. Some supermarkets may waste more than others.
- For rent and facilities, an obvious driver is the size of the store – if it’s too big, it will cost too much – so I’d break it down into “store size * cost per sqmt”.
- Finally, within labor costs, the amount of hours I’m paying for cashiers is extremely important especially if our “cashier utilization rate” is low, so I’ll create a structure that accommodates that driver.
Notice that I’m speaking about things very specific to supermarkets: cashiers, food waste, mix of items in the basket, store size and how many hours cashiers work in total. This specificity is what makes this step so important.
Here’s the final issue tree after adjusting for all the issues in the bullet points above…
(Besides the first layer, this tree identical to the one I’ve shown you in the beginning of this article):
This last layer gives our profit tree a specificity that makes it work ONLY in the supermarket industry.
It also helps us show the interviewer that we have a good idea of what are the important drivers in this type of business.
In a real-world analysis, this would help us use the tree to find all different types of KPIs for the performance of this store. Here are a few examples of metrics you could derive from this tree:
- “Cashier wage costs per transaction”
- “Cashier wage costs per dollar spent”
- “Revenue per sqmt (or sqft)”
- “Waste costs as a % of revenues”
And so on.
A tree like this is a great tool to diagnose profitability problems in a supermarket, and even to manage one!
Now, enough with supermarkets!
In the next section, we’ll see three examples of profitability trees we could build for other industries using this same technique, what makes them GREAT, and what types of insights we can derive from them.
Examples of Profitability Trees from Different Industries
I thought hard about which industries would teach you the most on how to use Profitability Trees.
I figured that variety matters.
And so I decided to build a profitability tree for three different, three completely different industries.
So in this section, we’ll explore how to build a profitability tree for:
(1) a company in the Mining industry,
(2) a Fitness iPhone/Android App, and
(3) a Consulting Firm such as McKinsey, Bain or BCG.
From this, I hope you get two things:
- Exactly how to apply the 4 step process I showed in the last section.
- The nuances of how specific you should go in each part of your tree, and how customized should it be.
Ready? Let’s start!
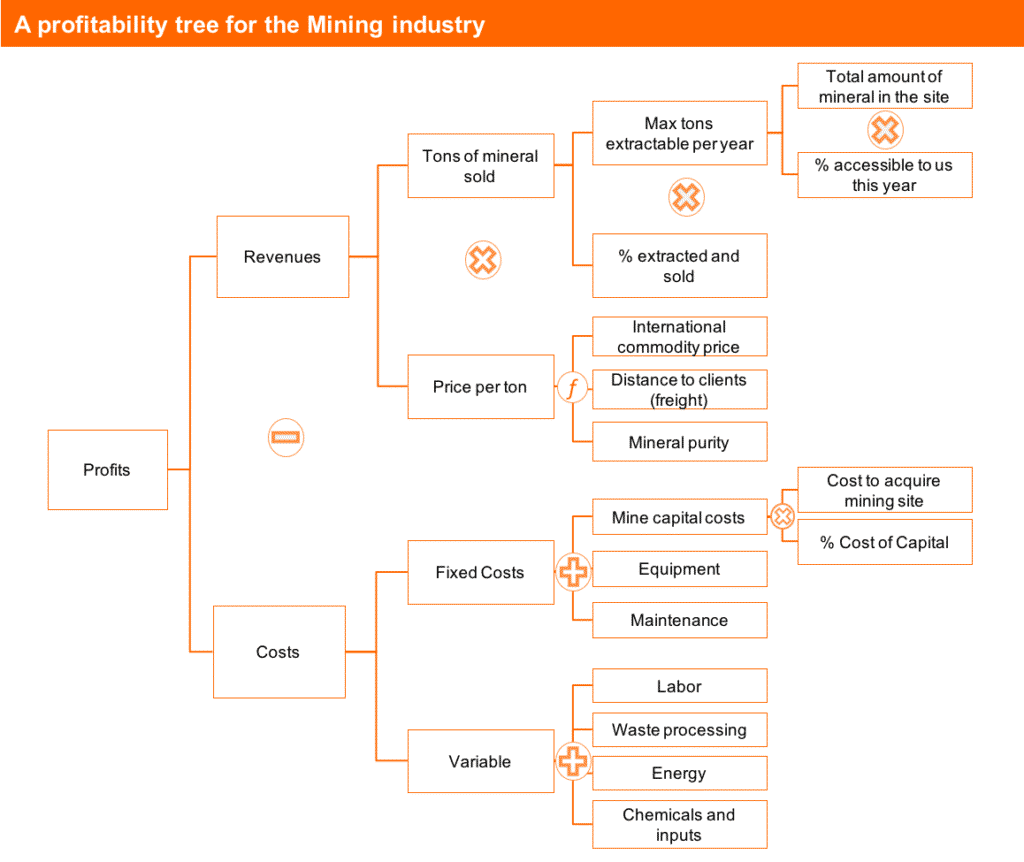
A Profitability Tree example for the Mining industry
For this example, I’ll show you a profit tree for a mining company that has ONE mine that mines ONE mineral (think something like iron ore).
So, how did I build this tree?
First of all, I’d love you to know that I have NEVER worked in mining before and that I didn’t research the industry before building this tree.
Why?
Because I want to keep real with you. I want you to see how you can use this tool to build a good structure in your interviews.
In a real-life consulting project, I’d probably start off with a tree like this one (that I created using my own judgment) and then I’d research the industry and talk to people to improve it.
I’d validate buckets that I’m not sure should be here, and try to find new buckets that I haven’t thought of.
Now, let’s review how I built this tree following the 4 step approach I laid out earlier in this guide:
Step 1: Choosing the first layer
I just went with Revenues – Costs.
I did it because it works and there’s no need to overthink this.
Seriously, it’s that simple.
(To be honest, I also thought I’d include revenue from “extra” minerals we could find while extracting the main mineable mineral in this mine. I decided not to include it to make things simple, but this is one thing I’d keep in my head and if there were any indication during the case that it could be an issue, I’d look more into that).
Step 2: Choosing the Revenue Model
This is one industry where “Price * Quantity” works well enough, so I just used that.
Within “Quantity”, however, I followed an approach that is unusual to other industries.
In most industries, how much you sell depends more on how much you can get other people to buy from you that in how much you can produce. You’ll usually break down total volume sold as “Total Market Size * Market Share”, or something similar.
In the mining industry however, because most minerals are commodities (and I’m assuming this one is), you can sell roughly as much as you can produce, as long as you’re producing it below market prices.
In reality it’s not this simple, but still… Most mines are able to sell as much as they produce (as long as there is one other mine that has higher costs than they do).
That means I chose to break down “Tons of mineral sold” as “Max tons extractable (which is the maximum capacity)” * “% that is actually extracted and sold”.
Now we have a customized revenue model for this mining operation. I only included the details later, on Step 4, so let’s jump into the cost structure.
Step 3: Creating a cost structure and listing major costs
Here I just used the “Fixed + Variable” mini-framework.
It makes sense and it helps solve the problem.
One question that went through my head (and that should always go through yours) is: “variable to what?”.
I defined “variable costs” as costs that vary according to “tons of mineral mined”, that is, quantity. It’s pretty obvious, but it’s also an important mental step to go through so your structure makes sense in the end.
The next thing to be concerned about is to list of all of the major costs.
Earlier in the article, I mentioned you can have a secondary, “back-in-your-head” structure of costs to “make, sell and support the operation”.
This would NOT work well here, because in a capital-intensive, commodity business such as mining, the costs to sell (and even support) are negligible.
HOWEVER, we can still use the same principles to help us out here.
The principle behind the “make, sell, support” mini-frameworks is that these are the broad processes underlying the work of any company.
In a mining company, the broad processes that underlie it are:
(1) Setting up the mine and equipment to it’s mineable,
(2) digging, mining and separating the soil/rock,
(3) moving stuff around (metal and dirt) before you can sell it.
This is the “mini-framework” I kept in the back of my head while looking for fixed and variable costs.
And because of this “mini-framework”, I was able to find costs that are highly relevant for the mining industry that most candidates would not notice, such as “chemicals and inputs” to separate metal from soil, “energy” to power the equipment and vehicles, and “waste processing” because you have to do something with the mountain of material you’ve moved around (along with all the chemicals that you used).
Step 4: Going deep into specific revenue and cost drivers
I chose 3 main drivers of this business to dig a little deeper.
Here they are:
- “Max tons extractable per year”
- “Price per ton”
- “Mine capital costs”
I chose these drivers because (1) they’re HIGHLY relevant to how profitable a mine is, and (2) I don’t think just looking at the number would paint a detailed enough story.
For example, when I looked at “Max tons extractable per year”, I immediately thought that if this number were low, I’d be in doubt if this was a problem with the mine site (how much mineral was in there) or with how much we’ve developed it (how much of that mineral is currently accessible to us).
These are two completely different problems with completely different solutions.
And when I looked at “Price per ton”, I thought there was more to it than the number you see in the Bloomberg terminal or when reading the Wall Street Journal.
Maybe customers are willing to pay more for our mineral because it’s purer. Or maybe they’re willing to pay less because our mine is so far away, and metal is so expensive to transport, that unless we charge less, they’d rather purchase mineral from a more local supplier.
And when I took a look at the cost of the mine itself, I immediately thought: “if we’re spending too much on it, is it because we overpaid for the mine or because our financing conditions sucked?”.
Going into depth in drivers I deem important in an exceptional way to show two things to the interviewer: (1) you can go into depth if needed and (2) your structure is uniquely created by you.
A Profitability Tree example for a smartphone Fitness App
What’s the opposite of mining?
I don’t think this is a valid question, but if it were, I’d say a Fitness App is a more than acceptable answer.
So, let’s exercise our Profitability Tree muscles (pun intended 😉 ) and build a profit tree for a company that makes and distributes a smartphone fitness app for Android and iOS.
Here it is:
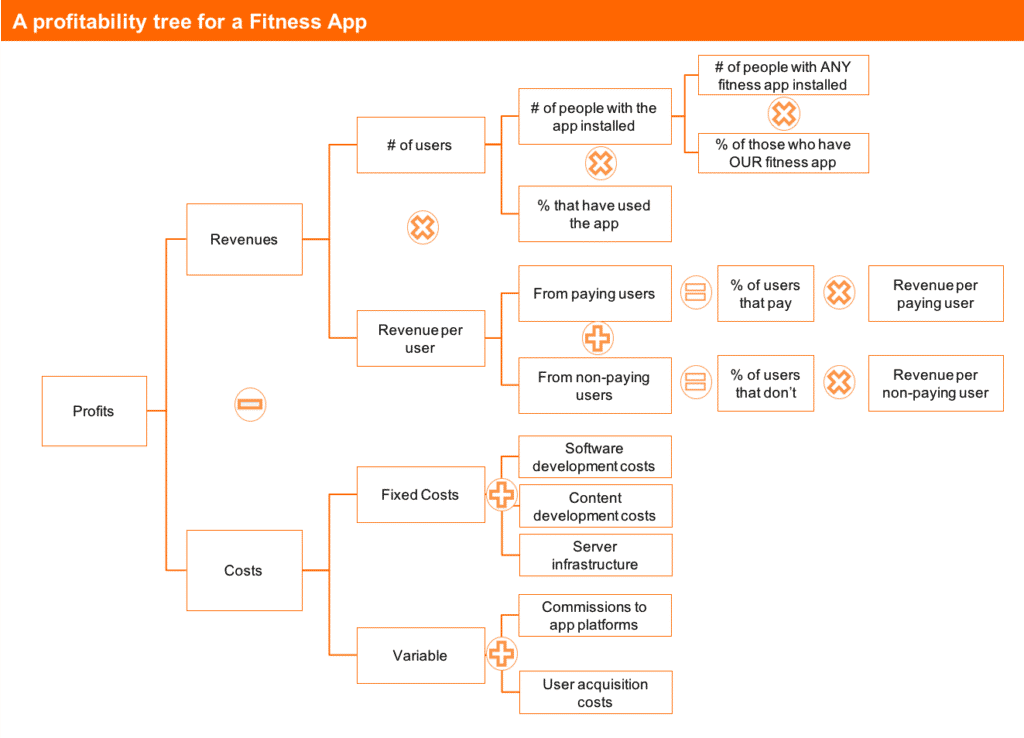
- For the Revenue model, I have used a “# of users * Revenue per user” structure. It makes much more sense than “Quantity * Price” (quantity of what? Couldn’t it be a subscription-based app?) and describes beautifully the main growth driver of an app is to have more active users.
- I have considered that a Fitness App can get revenues from paying AND non-paying users. They can, for example, have advertising revenue from the non-paying folks if they operate on a freemium model (as most of these apps do). This is an important insight to have as you build the tree.
- I have considered that most people choose that they will download a fitness app first and THEN decide which one. (Hence the “# of people with ANY fitness app * % of those who have OURS” formula). I have also considered that not everyone who downloads it becomes an active user (which is essential to generate revenues).
- On the cost side, the most important insights I brought are: (1) there is not only software development costs, but also content development costs (e.g. videos of the workouts), (2) you may have to pay commissions to Apple/Google for the revenues you generate from their apps, and (3) if you have a predictable marketing funnel, user acquisition costs (i.e. spend on ads, if that’s your marketing channel) are variable relative to the number of new users on the platform – the more you spend in ads, the more users you have.
Not to say that this profit tree is perfect (it isn’t), but your goal is to bring as many insights about the business model embedded in the structure as I aimed to do in this example.
It is hard to think how this profitability tree could be used outside of the smartphone app industry, and it’s hard (although possible) to think about things that are highly relevant to this industry that I haven’t mentioned in this tree.
These two attributes from the last phrase are what makes it an excellent profit tree to work with.
One thing I want you to notice: I have made a bunch of assumptions regarding the business model of this Fitness App that may or may not be valid (as different fitness apps have different business models).
Among them:
- That they are on a freemium model (or that they could turn into a freemium app if they wanted)
- That they produce their own content (most fitness apps do, but some, such as running trackers, don’t)
- That they acquire users through advertising (again, most apps do, but some don’t have variable user acquisition costs)
It’s okay to make these assumptions as long as you make them explicit in an interview. Even better: ask the interviewer if these assumptions are true as you build your tree.
They’re gonna be glad you did that.
A Profitability Tree example for a consulting firm such as McKinsey, Bain or BCG
I’m taking some risk doing this one.
I’ve worked at McKinsey and am now teaching you how to use one of their main tools to analyze McKinsey’s own business!
You probably expect I pull off a damn good profit tree here.
I’ll do my best, I promise.
Anyway, my goal with this last example is twofold:
(1) To help you solidify your understanding of how to build profitability trees for any industry,
(2) To help you understand a bit more about the consulting business model (always good to know about that).
But for this example, I want YOU to follow the 4 steps and build a profitability tree for McKinsey or BCG or Bain as if you were running the business before you compare it to mine.
Go grab a piece of paper (and maybe brew a good cup of tea or coffee) and do it before you reveal my tree.
I promise you it’s gonna be worth it!
Once you finish building your own, take a look at mine here:
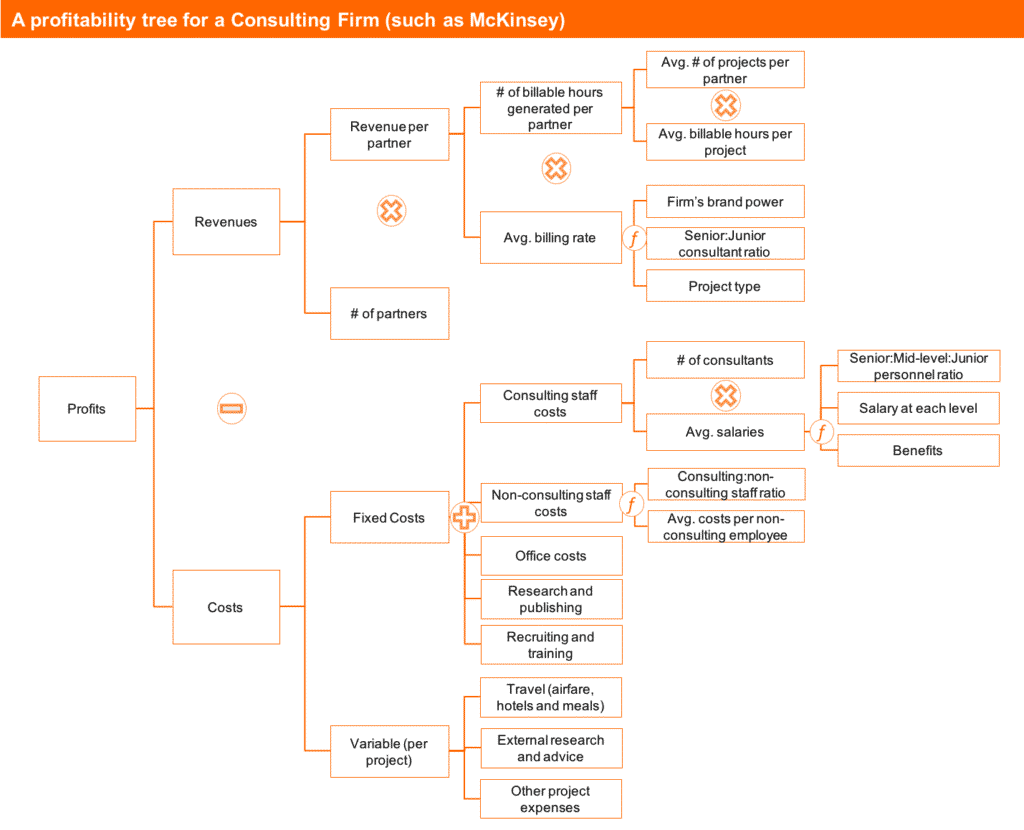
Here are a few of them:
- I chose to structure revenues with Partners as the drivers. As anyone who’s watched the TV show Suits, you know partners are the people who bring in clients to professional services firms. So a firm can grow by having more revenue generating partners or by having each partner bring in more revenue (the second option is preferred). There are many ways partners can do that, as you can see on the tree.
- I could’ve structured revenues differently. That’s true for any industry, but especially so for consulting. There are many ways I could’ve done that. A firm with very loyal clients could choose to see their revenues as “revenue per client * number of clients”. A firm with a sales process that doesn’t depend on partners could see it as the “# of projects * revenue per project”. It all depends on the specifics of the situation.
- The consulting business model is all about balancing “Revenue per Partner”, “Leveraging” and “Staff Costs”. As I said earlier, a good Profit Tree lets you take a sneak peek into an industry’s key business drivers. In the case of consulting, it’s all about balancing three things: (1) how much revenue a partner brings in, (2) how much work a partner “leverages” with more junior consulting staff and non-consulting staff and (3) how much that “leverageable” staff costs. Obviously, other costs and how many partners are there in a firm matter as well, but these are afterthoughts compared to the first three things. The Profit Tree helps you see that (although you definitely need to have a critical eye when you look at it).
- Staff costs are fixed on a per project “view”. Top consulting firms rarely hire because they’re getting a couple of new projects in the office. And they rarely fire based on a shortage of engagements. That means their main costs are fixed against revenues (in the short term at least). This explains, in part, why the industry is so competitive and hours are so long: they’ve got to pay the bills, so they’ll work as hard as possible to keep their clients and generate new projects.
How does that compare with the tree that you drew? Can you take the same insights out or your own tree?
Let me know in the comment section at the bottom of this article!
Profitability Trees: your secret weapon to think through business problems!
I don’t know if you’re into cooking or not, but if you think you know how to use a knife in the kitchen, you seriously need to catch up on Netflix!
(And I highly recommend watching Chef’s Table – what an amazing show!!).
The thing with cooking knives is that everyone who’s stepped foot into a kitchen can use them, but almost no one is skilled at using them.
And if your goal is to become a chef, being highly skilled at using knives can make or break your career.
But this website isn’t about cooking, so back to consulting…
Everyone who’s looked at the Profitability Frameworks can use it.
Few people are actually skilled in using it.
Even fewer are skilled at crafting customized Profit Trees for the specific business and the specific situation they must tackle.
And being able to do that can make or break your career as a consultant, whether you’re one already, or aspire to be one.
In fact, Profit Trees are the #1 skill I tell people they should master when they ask me how to learn to think like a consultant without going into consulting.
When I say that, most people dismiss it.
They say: “Yeah, whatever, I know how to analyze profits, that’s easy”.
Still, when I give them a simple business problem to solve and they can’t do it!
They don’t know how to ask the right questions and don’t know how to find the right insights.
Why?
Almost 100% of the time, because they can’t manipulate customized profit trees.
As you’ve seen in this guide, you can’t expect the “Profitability Framework” to do all the work for you.
And because everyone thinks they have mastered profit analysis, but few people actually did, this can be your secret weapon.
Whether you use Profit Trees explicitly, or in the back of your head, you can be sure that they will enable you to (1) see the profit drivers of any business, (2) uncover an industry’s key metrics and (3) easily capture the essence of what’s causing one business to underperform and another to overperform their competitors!
Now I'd like to hear from you...
There you have it: The Complete Guide to Profitability Trees.
How are you gonna change the way you solve cases or analyze business after reading this?
And how is it gonna change your preparation?
Are you gonna start by mastering the Profitability Framework and its 4 core profit drivers or jump straight into customized Profit Trees?
